


Every data leader knows the queue. A finance manager needs margin by product line for a board meeting on Thursday. A supply chain director wants to know which SKUs are at stockout risk before the weekly ops call. An operations VP needs plant utilization figures before a capital conversation with the CFO.
Each of these is a straightforward business question. Each one sits in a ticket queue behind seven others. Each one requires a data analyst to interpret the request, write the query, validate the output, format it, and send it back. It’s a cycle that takes anywhere from hours to days, depending on team capacity and query complexity.
That gap, between a business question and the data infrastructure needed to answer it, creates organizational drag. It does not show up on a P&L. It shows up in decisions made on stale data, opportunities missed in the lag, and data teams perpetually behind on work that should not require them.
It is also, in 2026, largely unnecessary.
Picture a market research organization where analysts spend a significant portion of their time not interpreting data, but waiting for it. Slicing by segment, geography, time period, or demographic each requires either SQL knowledge the analyst does not have, or a request to someone who does. It is one of the clearest illustrations of the analyst bottleneck, because market research runs on exactly this kind of cutting, over and over, for every client question.
Now picture the alternative. A conversational analytics layer sits on top of the same data warehouse. Analysts type questions directly into their analytics dashboard, in plain language. The system interprets the question, selects the relevant schema context, generates SQL against the production data warehouse, and returns a live result in seconds, as a chart, a table, or a summary. The queue does not just shrink. It stops being the bottleneck, even when the team is fielding a high volume of queries every day.
That is the pattern Blackstraw builds toward with its NLP-to-SQL engine, and it is the same pattern we’ll walk through below across a few different business functions.
The term gets used loosely. A prompt box on top of a BI dashboard is not conversational analytics. A chatbot that returns pre-built report links is not conversational analytics either. A real implementation involves three distinct layers working together.
The experience layer is what the analyst sees. It’s built on agentic interaction frameworks like AG-UI (Agent-User Interaction), the general-purpose, bi-directional connection between a user-facing application and an agentic backend, and related protocols like A2UI (Agent-to-User Interface), which is distinct from A2A (Agent-to-Agent, used for agent-to-agent coordination rather than user interaction). This layer captures the natural language query alongside live dashboard state, understands what the user is looking at and what they’re trying to know, and routes that context to the AI agent.
The intelligence layer is what makes it reliable: an NLP-to-SQL engine that selects only the schema context relevant to the question, rather than trying to reason over an entire warehouse at once.
The data layer is your existing infrastructure, unchanged.
The key distinction: conversational analytics is not a product you buy and plug in. It’s a capability you build by connecting an intelligent experience layer to a reliable NLP-to-SQL engine sitting on your existing data platform. The value comes from the integration, not from any single component.
The clearest way to understand what this capability changes day to day is to follow one function through a realistic sequence of decisions. Supply chain is a strong illustration because a single disruption ripples across three distinct teams: procurement, inventory, and logistics. Each team asks a different question, and each needs an answer immediately rather than after a ticket clears.
The walkthrough below follows that ripple end to end. Same conversational layer. Same underlying engine. Three different teams, three different questions, each answered directly inside the tool they already use.
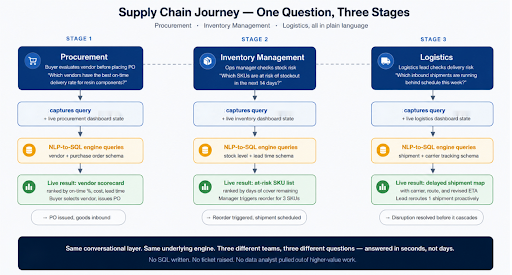
Figure 1 – The supply chain journey: Procurement → Inventory Management → Logistics, end to end
A buyer preparing to place a purchase order for resin components asks the system directly which vendors have the strongest on-time delivery record. The query runs against the vendor and purchase order schema and returns a live, ranked scorecard. No spreadsheet pull, no email to the data team. The buyer sees the answer, selects the top-ranked vendor, and issues the PO from the same screen.

Figure 2 — Illustrative interface: vendor scorecard query and live result
Once goods are inbound, an operations manager checks stock position across the warehouse network. Rather than waiting for a weekly inventory report, they ask which SKUs are at risk of stockout in the next 14 days. The system surfaces a ranked, live view of days-of-cover remaining, flags the SKUs below the safety threshold, and inside the same conversation triggers the reorder.
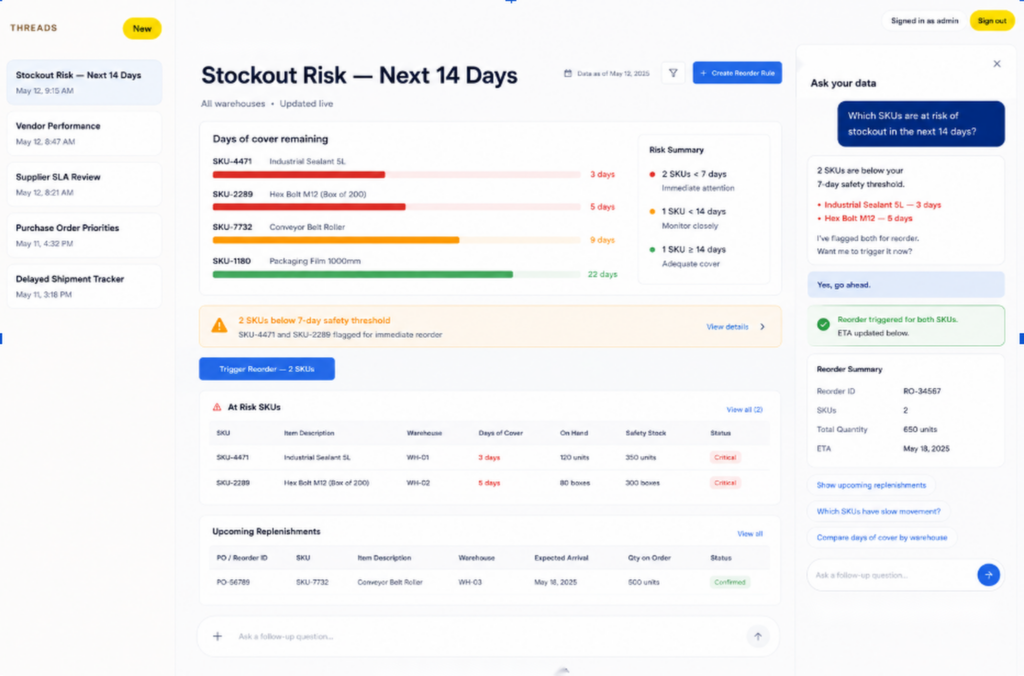
Figure 3 – Illustrative interface: stockout risk query, flagged SKUs, and reorder action
With the reorder in motion, a logistics lead checks whether any inbound shipments are at risk of running behind schedule that week. The query returns a live shipment map with carrier, route, and revised ETA for any delayed orders, letting the lead proactively reroute a single at-risk shipment before the delay reaches the warehouse floor.
Three teams. Three different questions, phrased in their own language, against their own part of the schema. None of them touched SQL. None of them filed a ticket. None of them waited.
The supply chain journey is illustrative, not exclusive. The architecture underneath it is function-agnostic. What changes across other parts of the business is the vocabulary and the schema being queried, not the underlying capability. The examples below illustrate the kind of shift this pattern typically enables; exact turnaround times vary by organization, query complexity, and data maturity.
| Function | Before | With Conversational Analytics |
| 💰 Finance | Margin variance analysis takes days; board decks built from stale exports | CFO gets margin by product line in seconds, refreshed on demand before the meeting |
| 🔍 Market Research | Analysts file requests for every demographic cut, with requests queued behind others | Analysts self-serve segmentation live, during client calls |
| ⚙️ Operations | Plant utilization reports compiled periodically from multiple spreadsheets | Utilization and downtime drivers queried in real time, any day of the month |
| 📈 Sales & Commercial | Pipeline and territory questions routed through RevOps, often answered after the deal moment has passed | Reps and managers ask pipeline questions directly, get answers before the call |
Independent research is pointing the same direction Blackstraw’s own implementation work has: this is moving from experiment to standard practice, not staying a future roadmap item.
Gartner’s Hype Cycle for Analytics and Business Intelligence, 2026 names agentic analytics among its core trends for the year, tracking the same shift from proof of concept toward production use that we’re seeing in our own conversations with clients. IBM’s research on the biggest data trends for 2026 makes a related point directly: most user interactions with enterprise data and databases will soon be intermediated by agents, opening data access to a wider range of business and technical users, provided organizations also invest in the governance and skills to use it well. For broader context on where agentic AI is heading this year, IBM’s AI tech trends and predictions for 2026 is worth a look too.
With NLP-to-SQL, enterprise data platforms, and agentic user experience frameworks like AG-UI now production-ready, the practical question for most organizations isn’t whether this capability is real. It’s how soon to build it before the analyst queue becomes a competitive disadvantage rather than just an operational one.
The analyst bottleneck is a solvable problem. Conversational analytics eliminates the queue, returns the data team to high-value work, and gives every business user direct access to the data they need to make decisions. Organizations that build this now, while it’s still early, get a real head start over the ones who wait for it to become obvious.
If you’re weighing what this could look like on your own data platform, that’s exactly the kind of conversation our presales team has every week. Talk to Blackstraw about what a conversational analytics layer could look like on top of the systems you already run.
Note: the finance, market research, supply chain, operations, and sales examples above are illustrative composites built to demonstrate the pattern across functions. They are not a description of a single client engagement. Figures are illustrative concepts created for this piece and not screenshots of an actual product or client deployment.
Enjoying this article? Share it with the World


